Weather station
I recently bought some really interesting sensors for my fantastic Raspberry Pi to make a simple weather station and they’re really good actually. There’s more on the how-to page about the Pi and how to make the weather station, but this page is for the results, so here they are!
Daily Pressure Graph
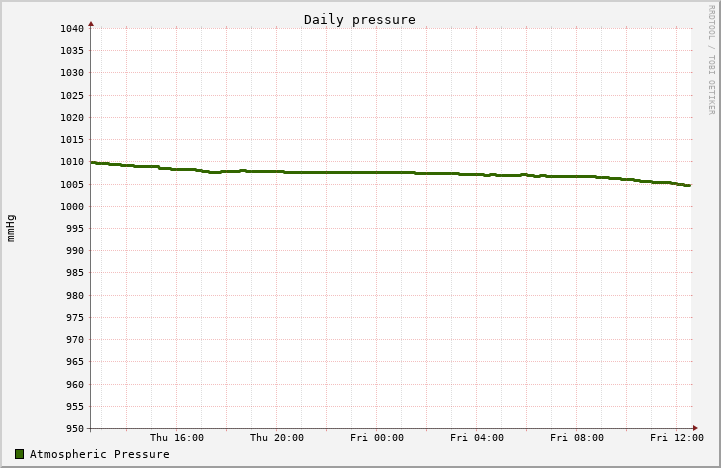
Graph of daily atmospheric pressure
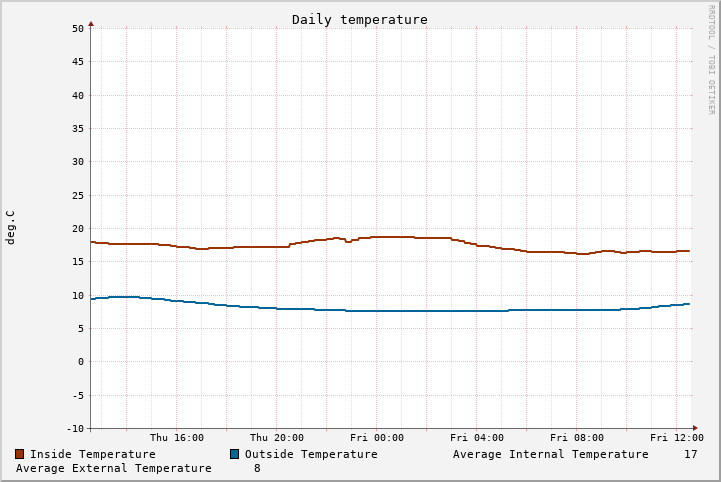
Graph of daily indoor and outdoor temperature
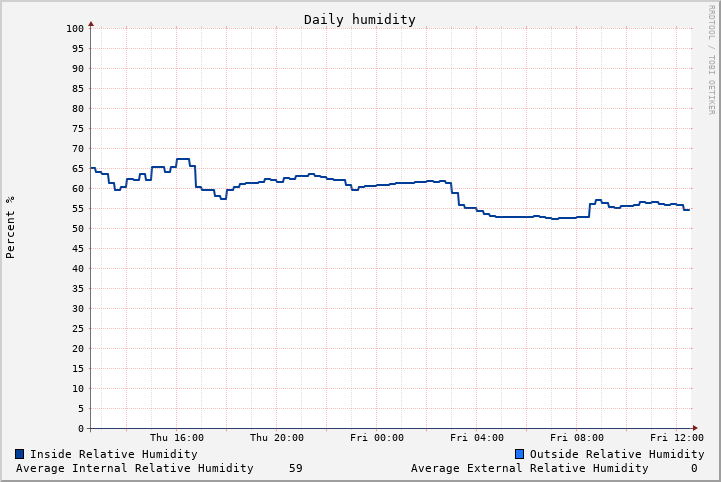
Graph of daily indoor and outdoor humidity
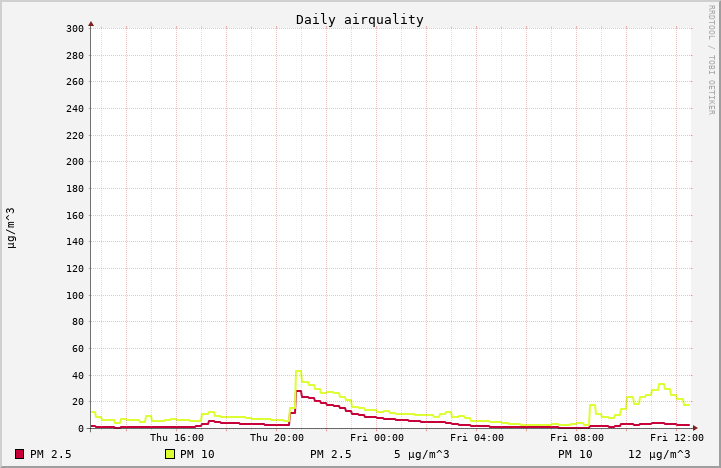
Graph of daily air quality
Weekly Pressure Graph
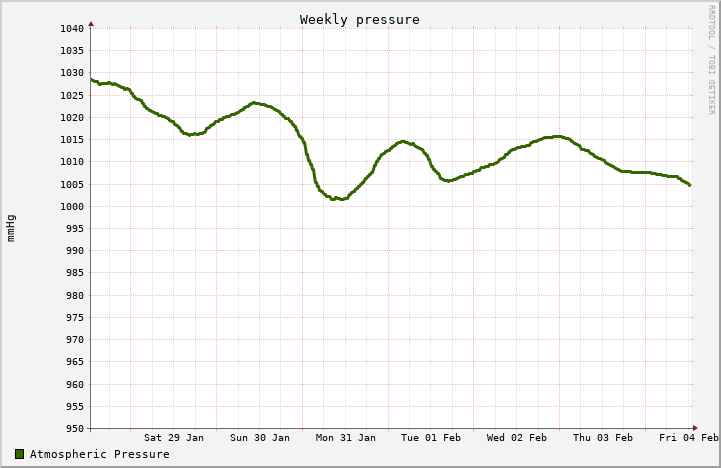
Graph of weekly atmospheric pressure
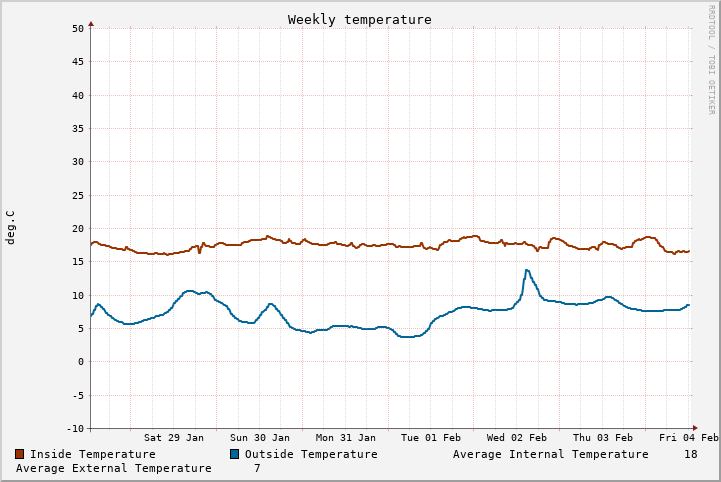
Graph of weekly indoor and outdoor temperature
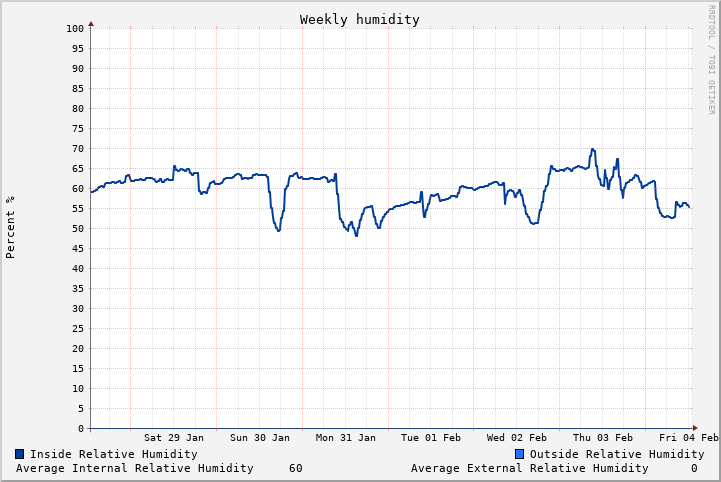
Graph of weekly indoor and outdoor humidity
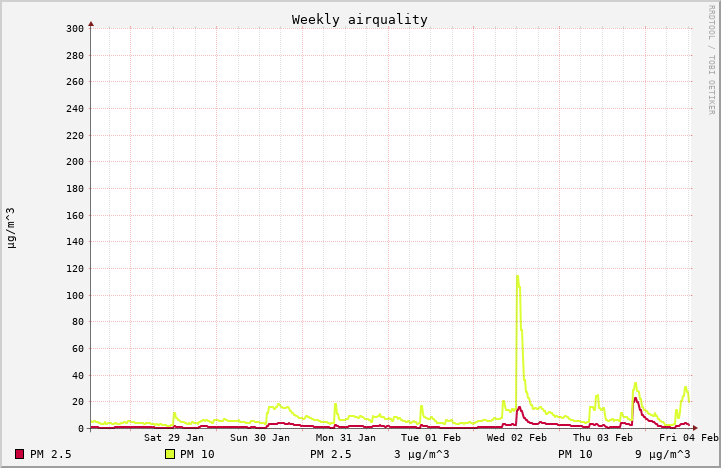
Graph of weekly air quality
Monthly Pressure Graph
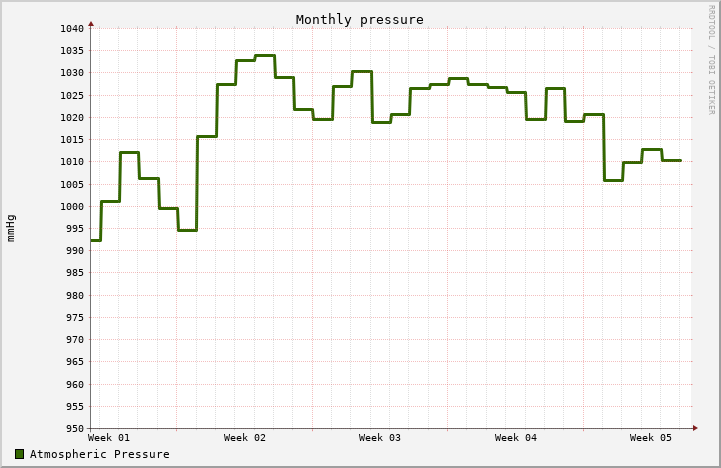
Graph of monthly atmospheric pressure
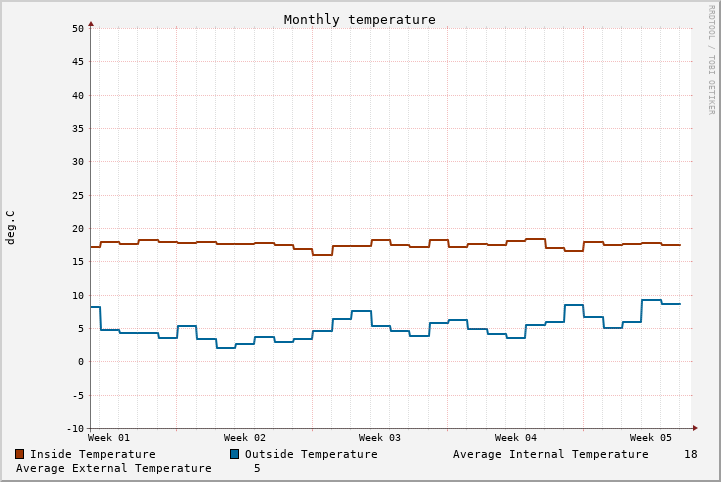
Graph of monthly indoor and outdoor temperature
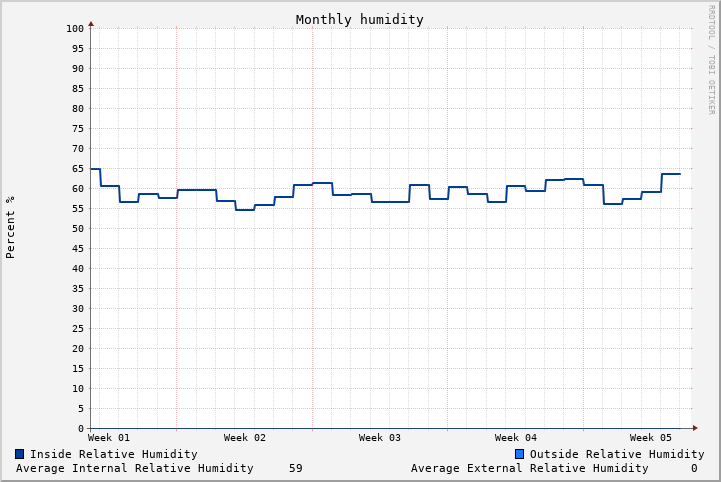
Graph of monthly indoor and outdoor humidity
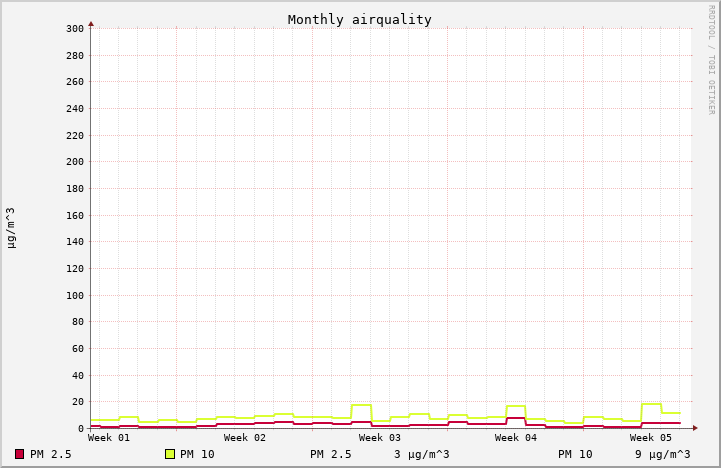
Graph of monthly air quality
Annual Pressure Graph
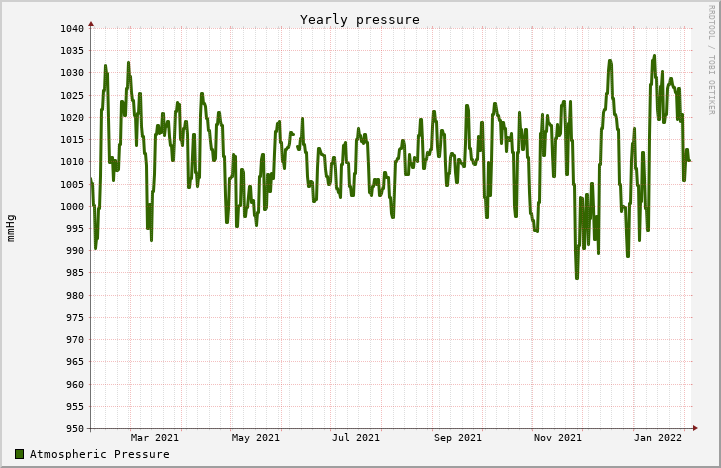
Graph of annual atmospheric pressure
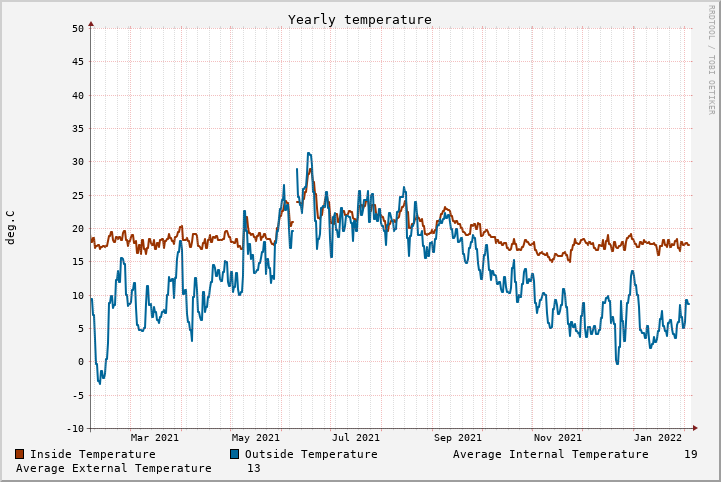
Graph of yearly indoor and outdoor temperature
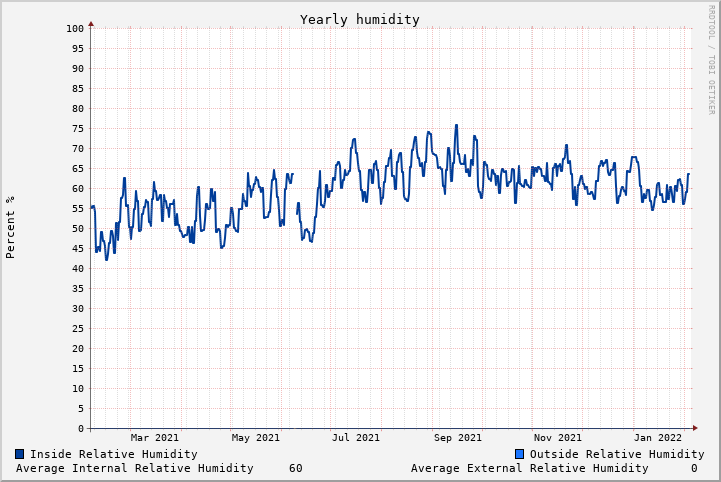
Graph of yearly indoor and outdoor humidity
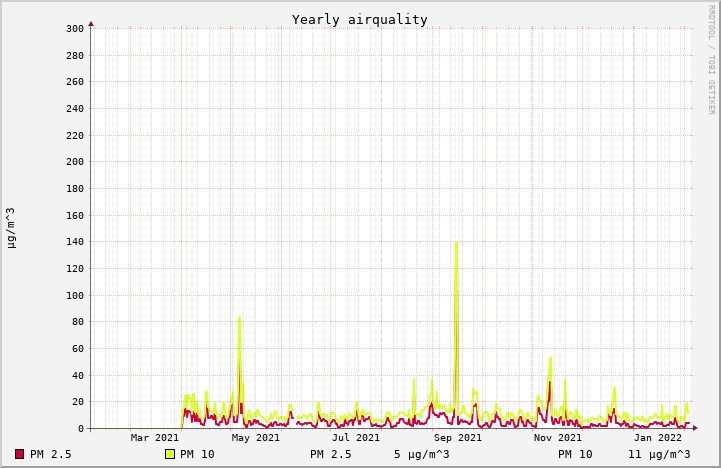
Graph of yearly air quality